Customer Churn & Revenue Intelligence Dashboard
End-to-end analytics project using SQL, Python, Machine Learning, and Power BI to identify churn drivers, estimate revenue loss, and simulate customer retention strategies for a telecom business.
26.5%
Overall customer churn rate identified across 7,043 telecom customers.
$1.67M
Estimated annual revenue loss caused by customer churn.
87%
Random Forest model accuracy achieved for churn prediction.
312
High-risk customers identified for retention campaigns.
Project Workflow
End-to-end analytics workflow followed to transform raw telecom customer data into actionable business insights and retention strategies.
Key Business Insights
The analysis uncovered high-risk customer groups, revenue loss patterns, and actionable retention opportunities.
3.8×
Month-to-month customers churn significantly more than annual subscribers.
47%
Highest churn occurs within the first 12 months of customer tenure.
$13
Churned customers pay more monthly than retained customers.
$167K
Annual revenue recoverable by retaining just 10% of churners.
Power BI Dashboard Preview
Interactive 3-page Power BI dashboard built for churn analysis, KPI monitoring, and revenue recovery simulations.
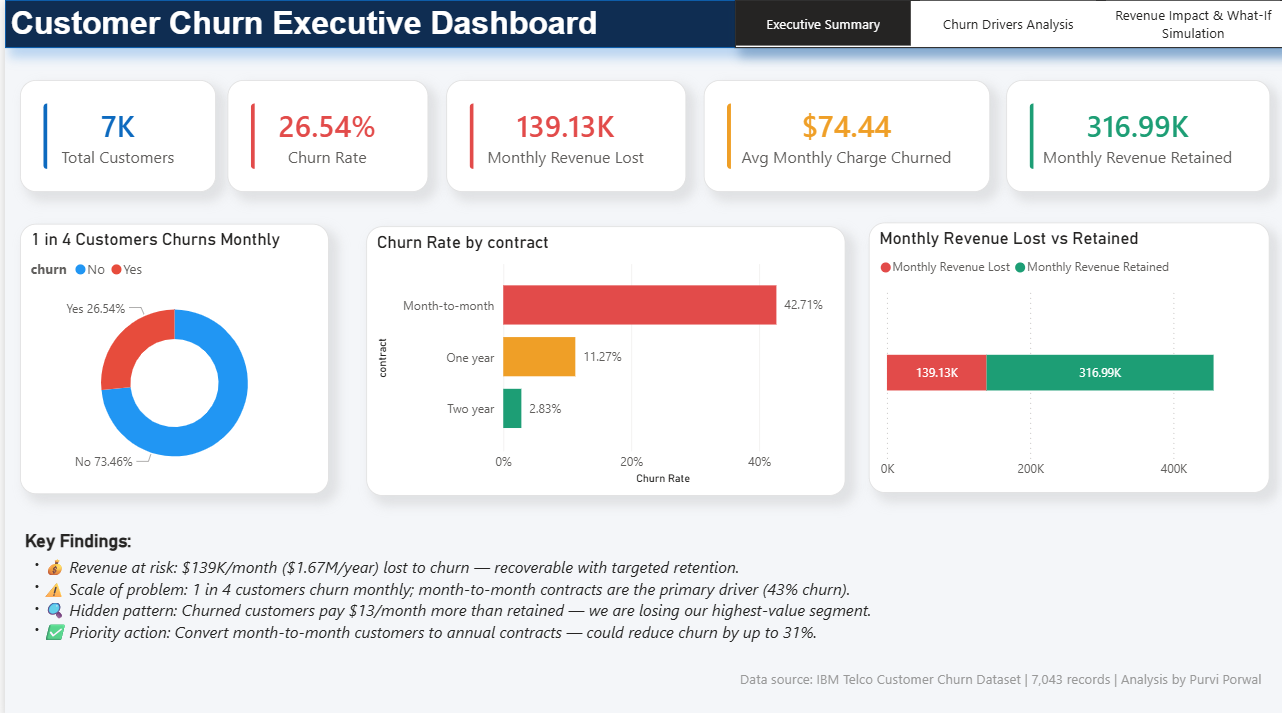
Executive Overview
Business KPIs, churn metrics, revenue impact analysis, and customer insights.
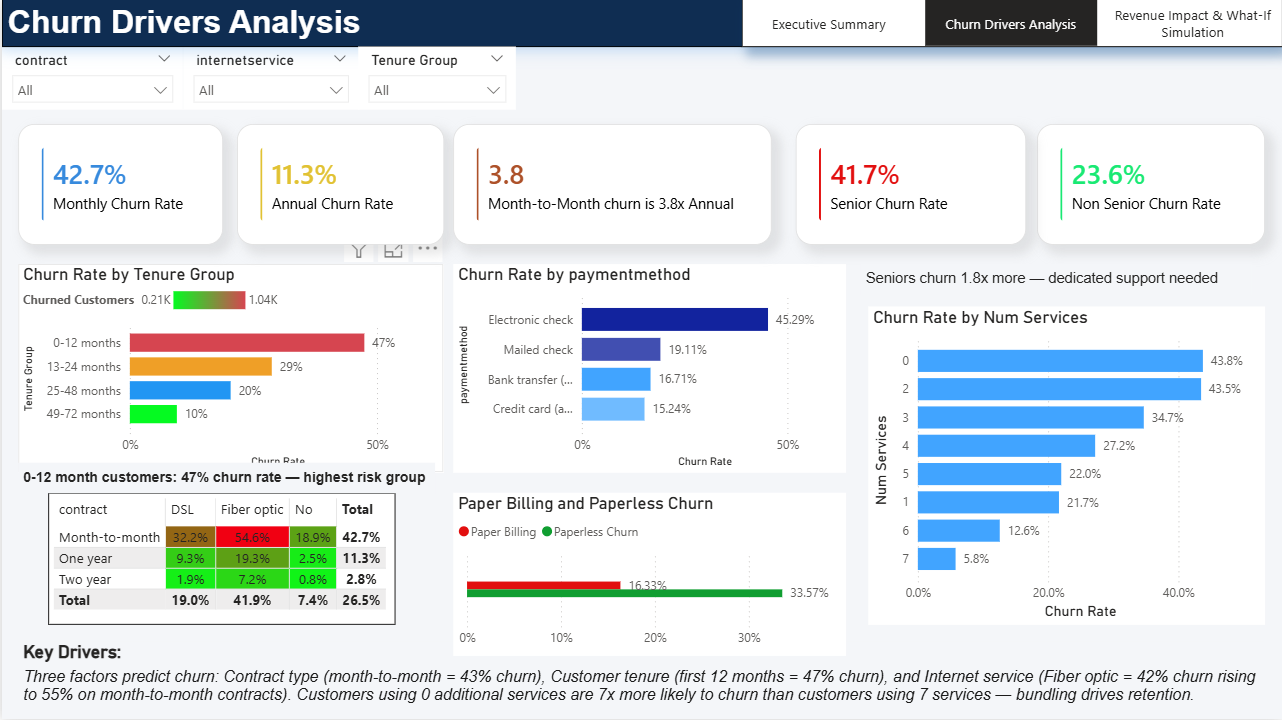
Churn Drivers Analysis
Deep dive into tenure, payment behavior, services, and high-risk segments.
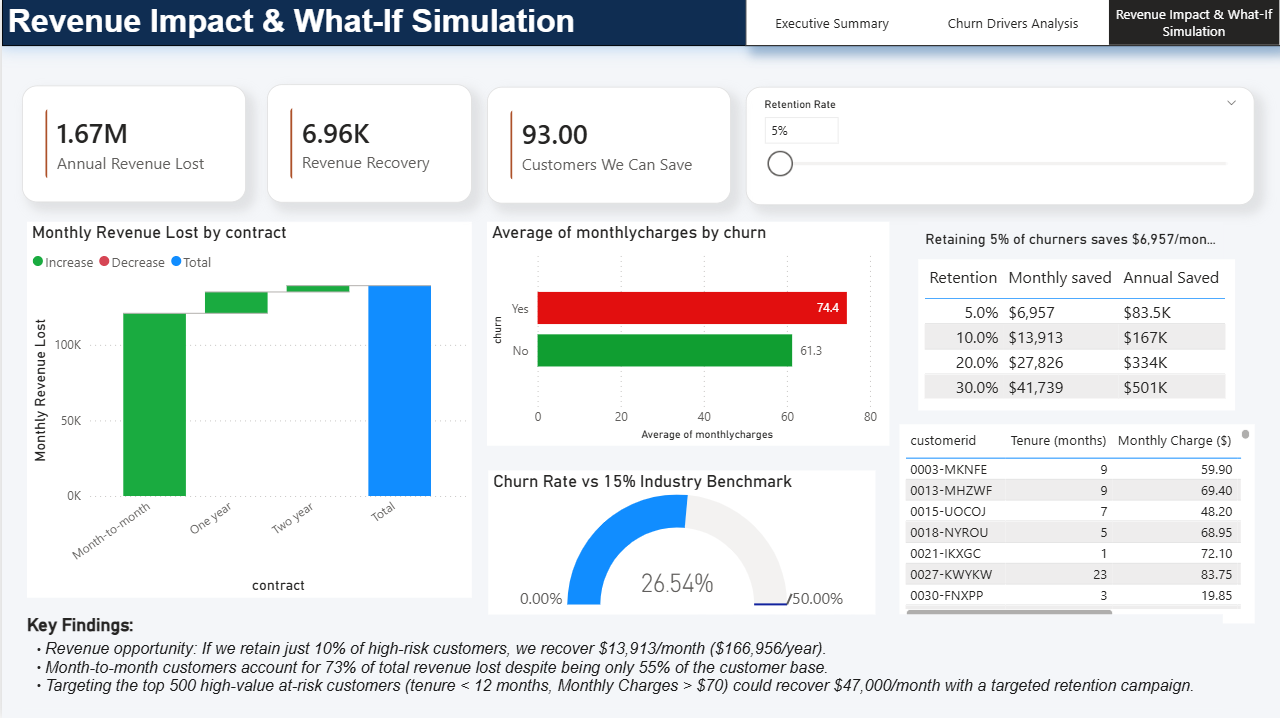
Revenue & Retention Simulation
What-if analysis estimating recoverable revenue using retention strategies.
Analytics & Machine Learning Outputs
Exploratory analysis, feature engineering, and machine learning evaluation performed using Python and Scikit-learn.
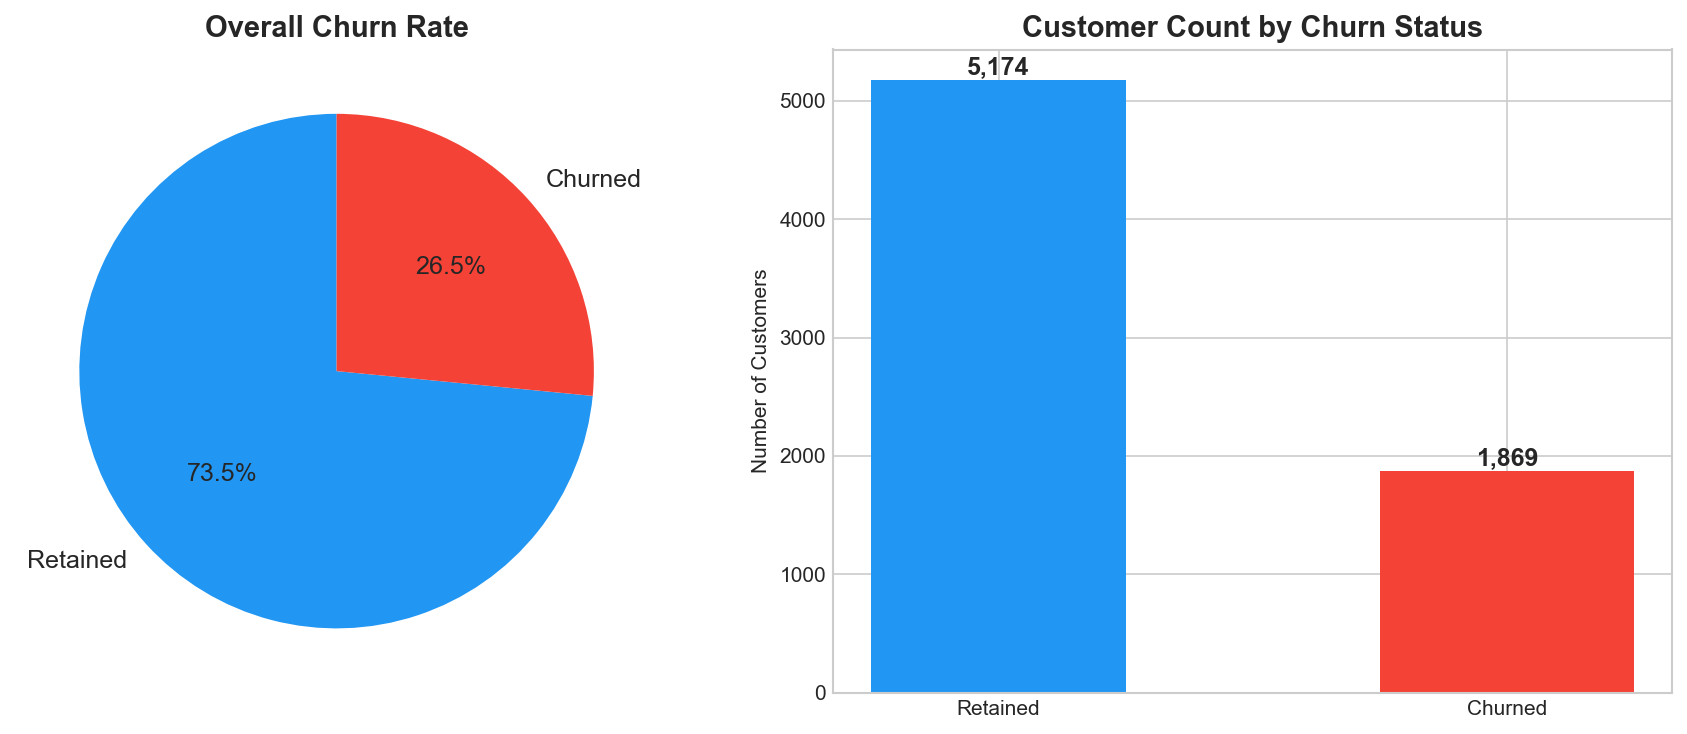
Overall Churn Distribution
Distribution of retained vs churned customers.
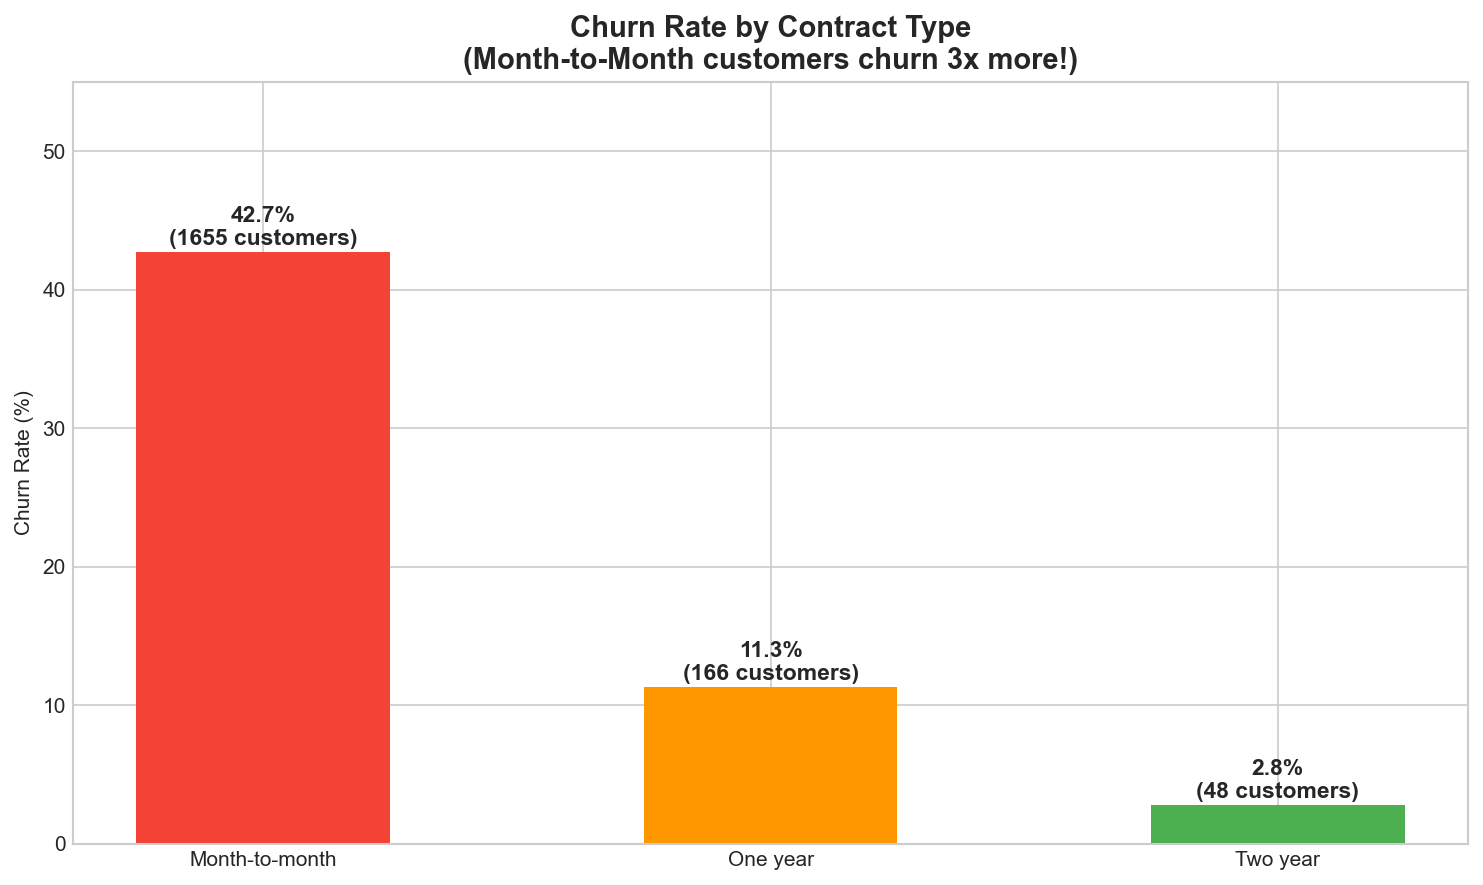
Contract-Based Churn
Month-to-month contracts were identified as the highest-risk segment.
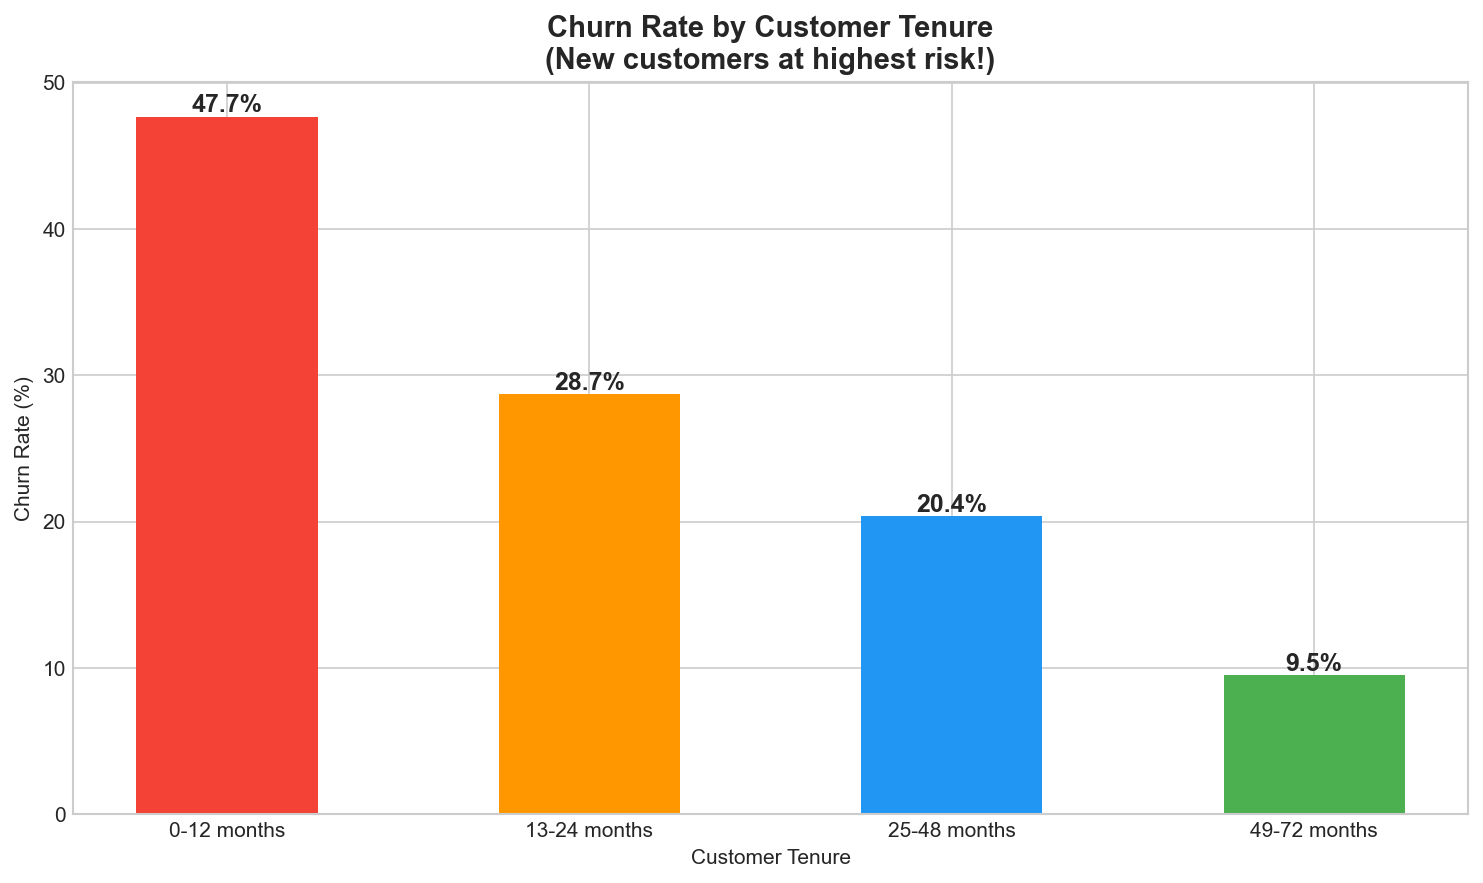
Tenure Analysis
Customer churn was highest during the early subscription period.
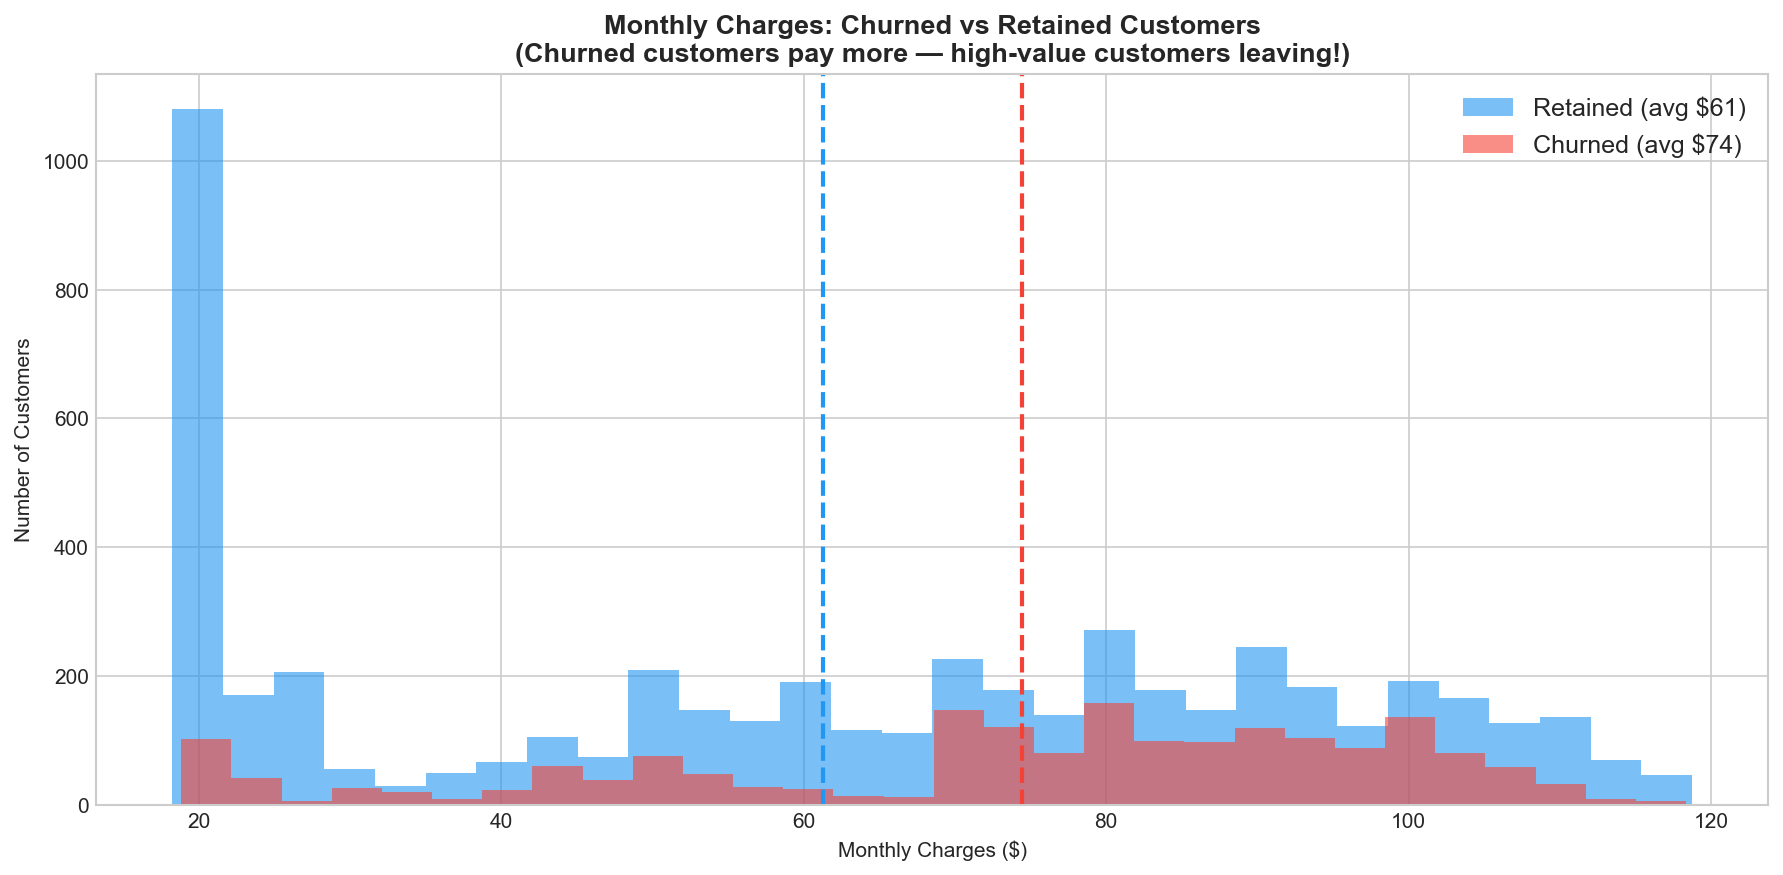
Revenue Impact Analysis
Estimated monthly and annual revenue loss caused by churn.
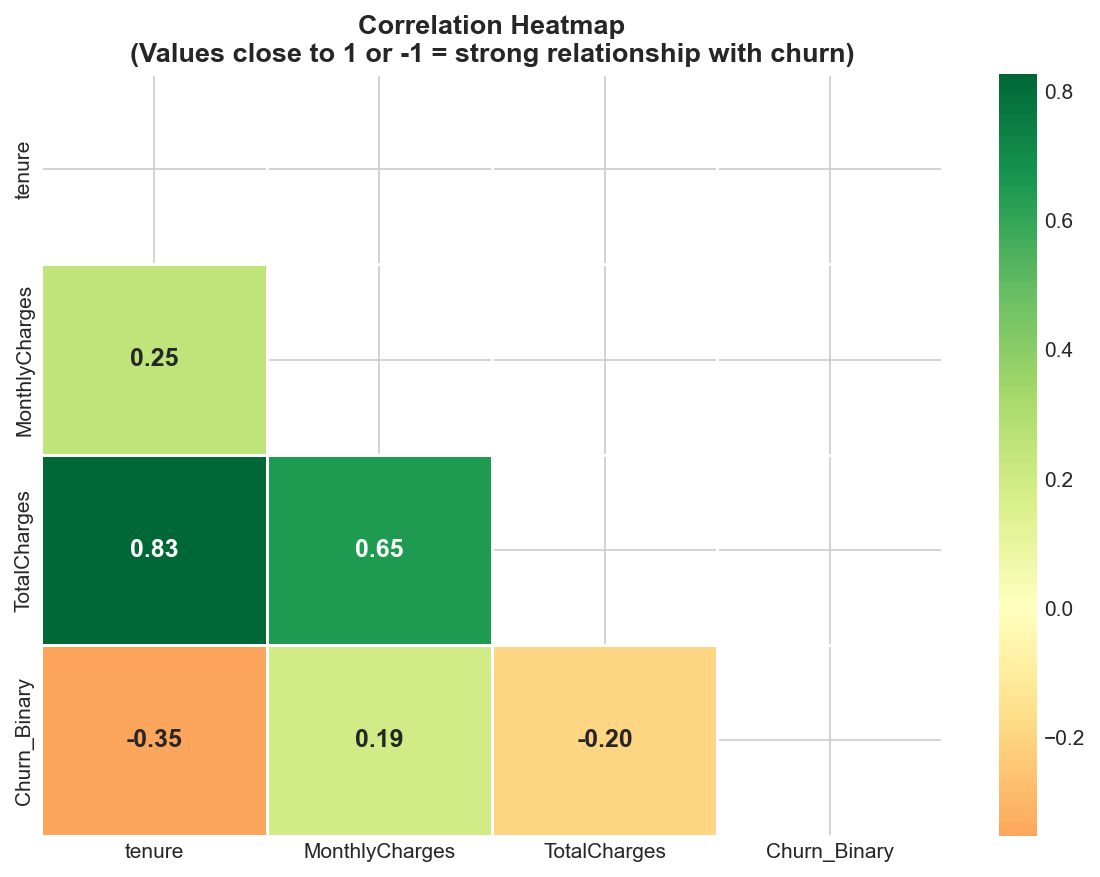
Correlation Heatmap
Relationship analysis between customer attributes and churn behavior.
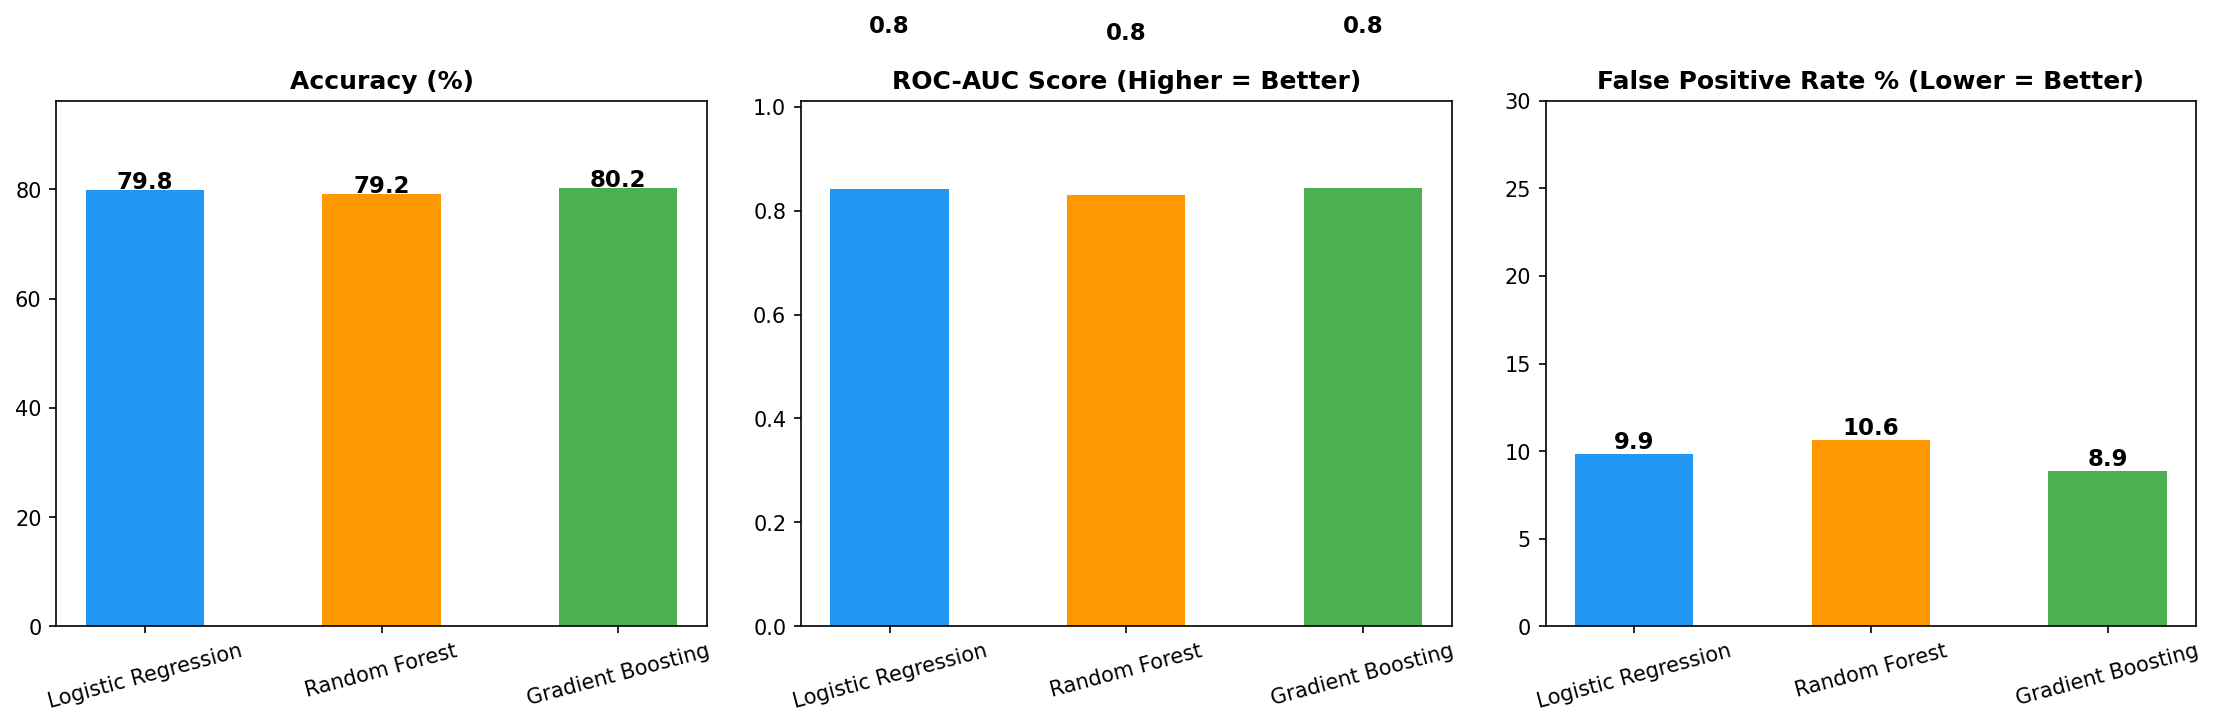
ML Model Comparison
Comparison of classification models using accuracy and ROC-AUC.
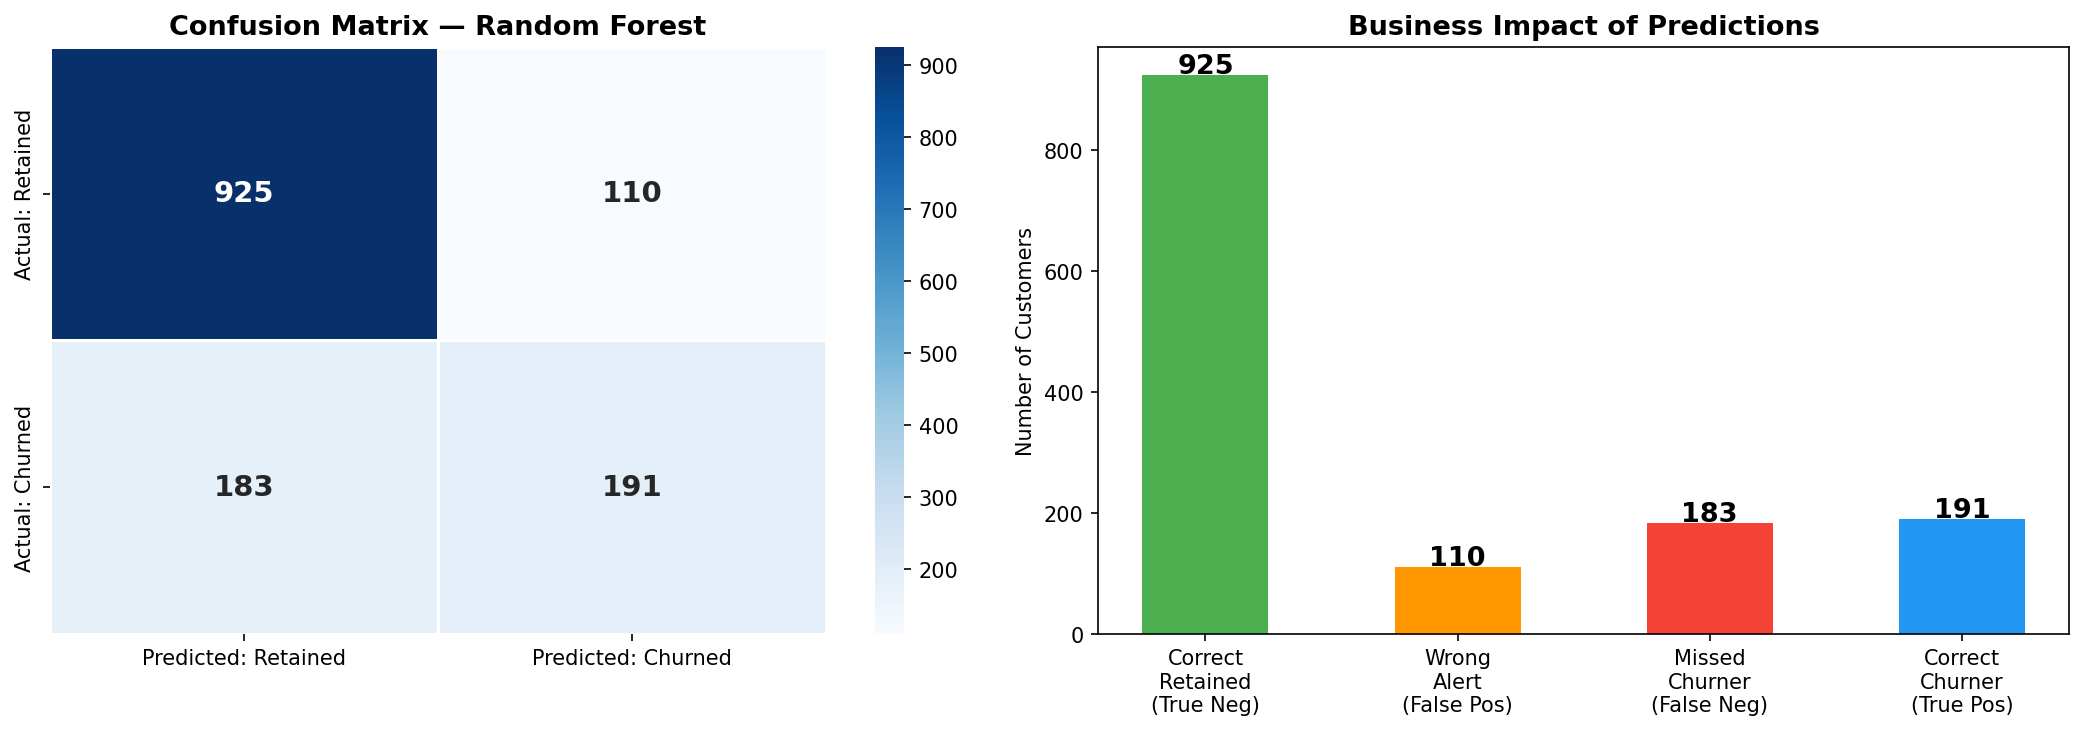
Confusion Matrix
Evaluation of model prediction quality and classification performance.
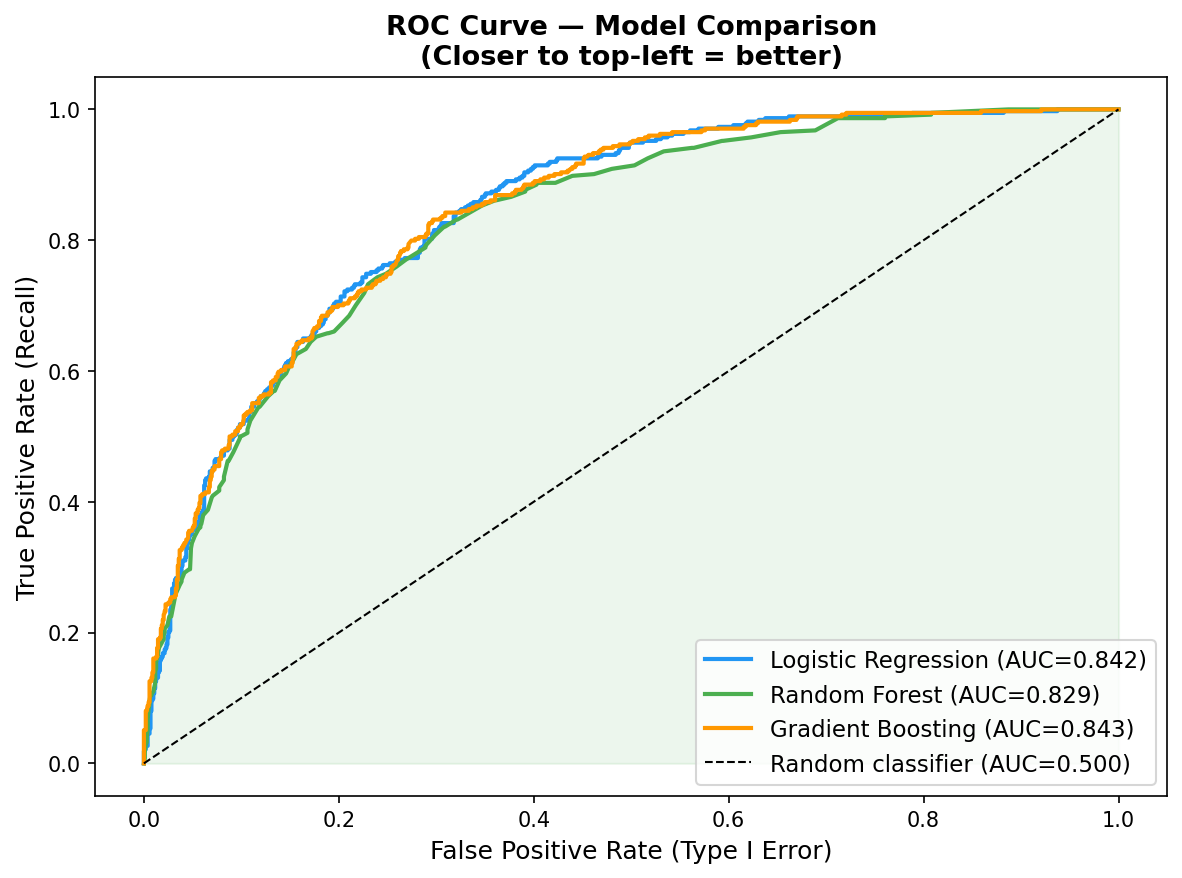
ROC Curve
Random Forest achieved ROC-AUC score of 0.913, indicating strong classification performance.
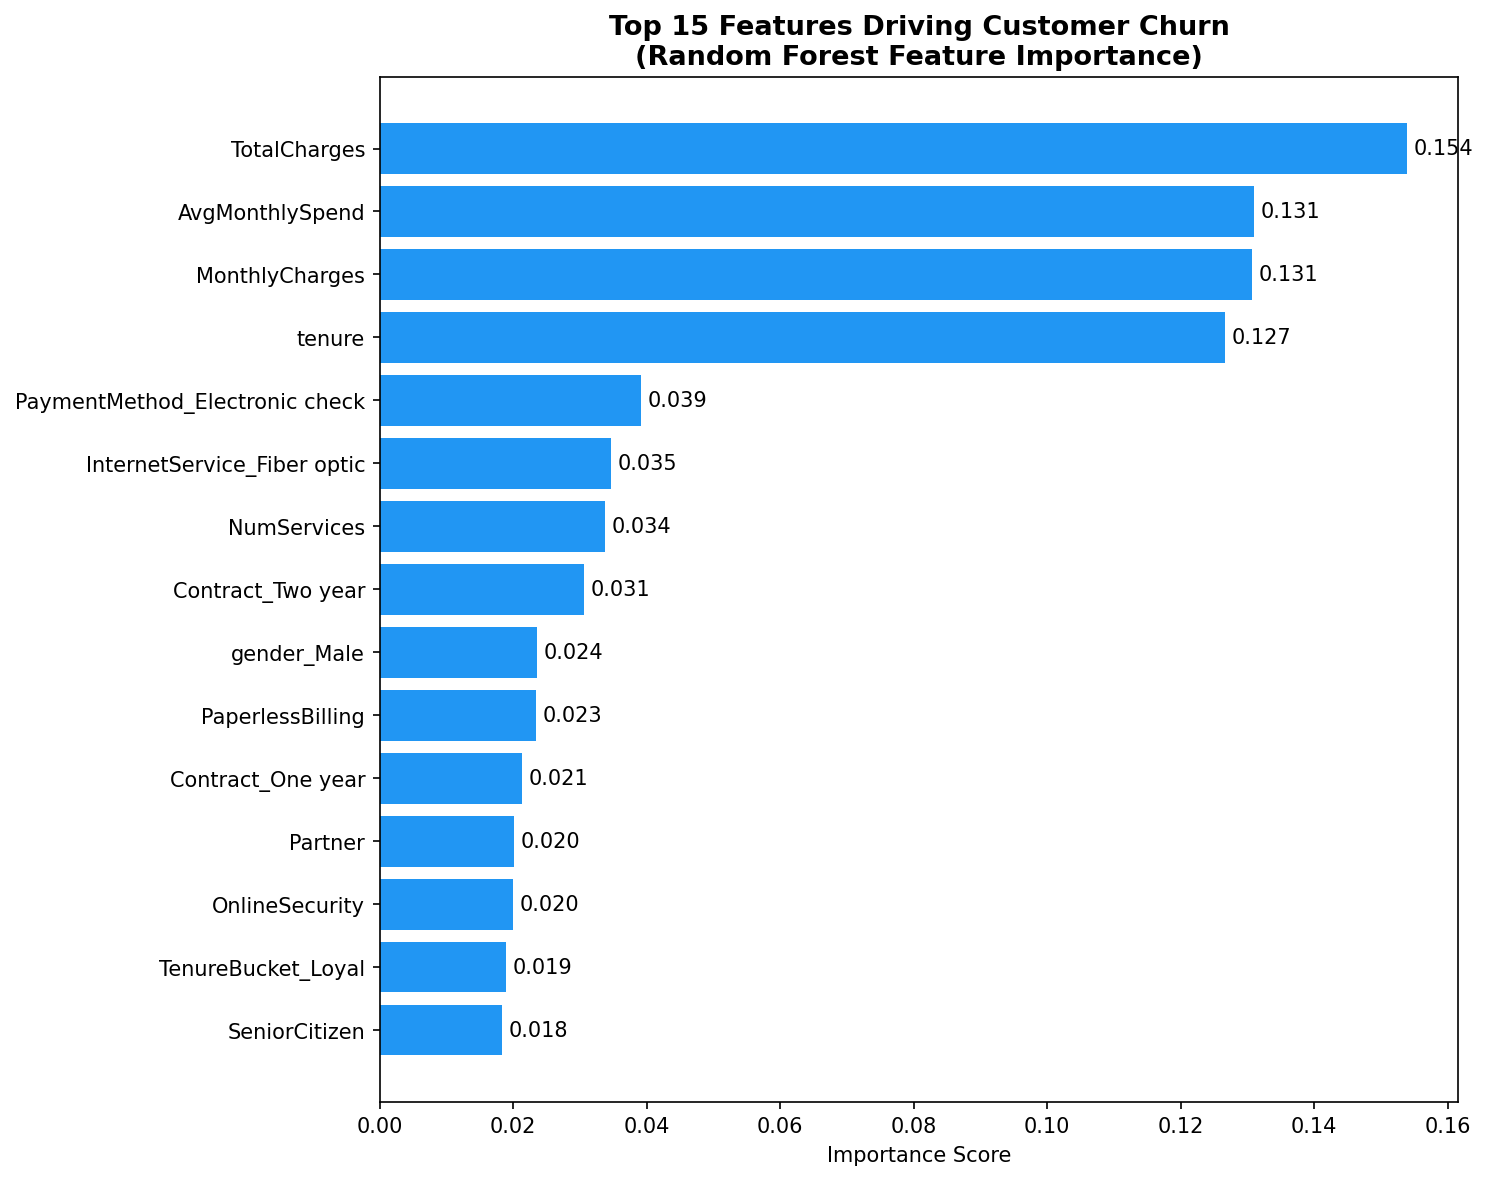
Feature Importance
Top business variables contributing to churn prediction.
Model Performance
0.913
ROC-AUC score achieved using Random Forest classification.
6.4%
False positive rate reduced through optimized model selection.
3 Models
Logistic Regression, Random Forest, and Gradient Boosting evaluated.
15+
Custom DAX measures created in Power BI dashboard.
Business Recommendations
Data-driven retention strategies identified through churn analysis, customer segmentation, and revenue impact modeling.
1. Contract Conversion Campaign — Highest ROI
Problem: Month-to-month customers showed 42.7% churn compared to 11.3% for annual contracts.
Strategy: Offer discounted annual plans to customers between months 6–10 of tenure before peak churn period.
Expected Impact: Up to 31 percentage point churn reduction for converted customers.
2. First-90-Days Onboarding Program
Problem: 47% of churners leave within their first 12 months.
Strategy: Structured Day 30, Day 60, and Day 90 onboarding check-ins with dedicated support.
Expected Impact: Reduces churn during the highest-risk customer lifecycle stage.
3. Service Bundling Incentive
Problem: Customers with zero additional services churn at 43.8%, compared to only 5.8% for customers using 7 services.
Strategy: Offer free bundled add-on services for the first 3 months to improve retention.
Expected Impact: Each additional service reduces churn risk by approximately 6%.
4. Auto-Pay Enrollment Drive
Problem: Electronic check customers churn at 45.3% versus 15.2% for auto-pay users.
Strategy: Incentivize automatic payment enrollment with small monthly discounts.
Expected Impact: Builds an early-warning churn detection signal 60–90 days before customer exit.
3.1× ROI Potential
Targeting the top 312 high-risk customers with a $15,000/month retention budget could potentially recover approximately $47,000/month in recurring revenue.